20-minute walkthrough with 2–3 personalized examples on your real pages.
Email, chat, or 24/7 phone support included on every paid plan.
One visitor profile behind all of it. Anything you build in one place is available in the others.
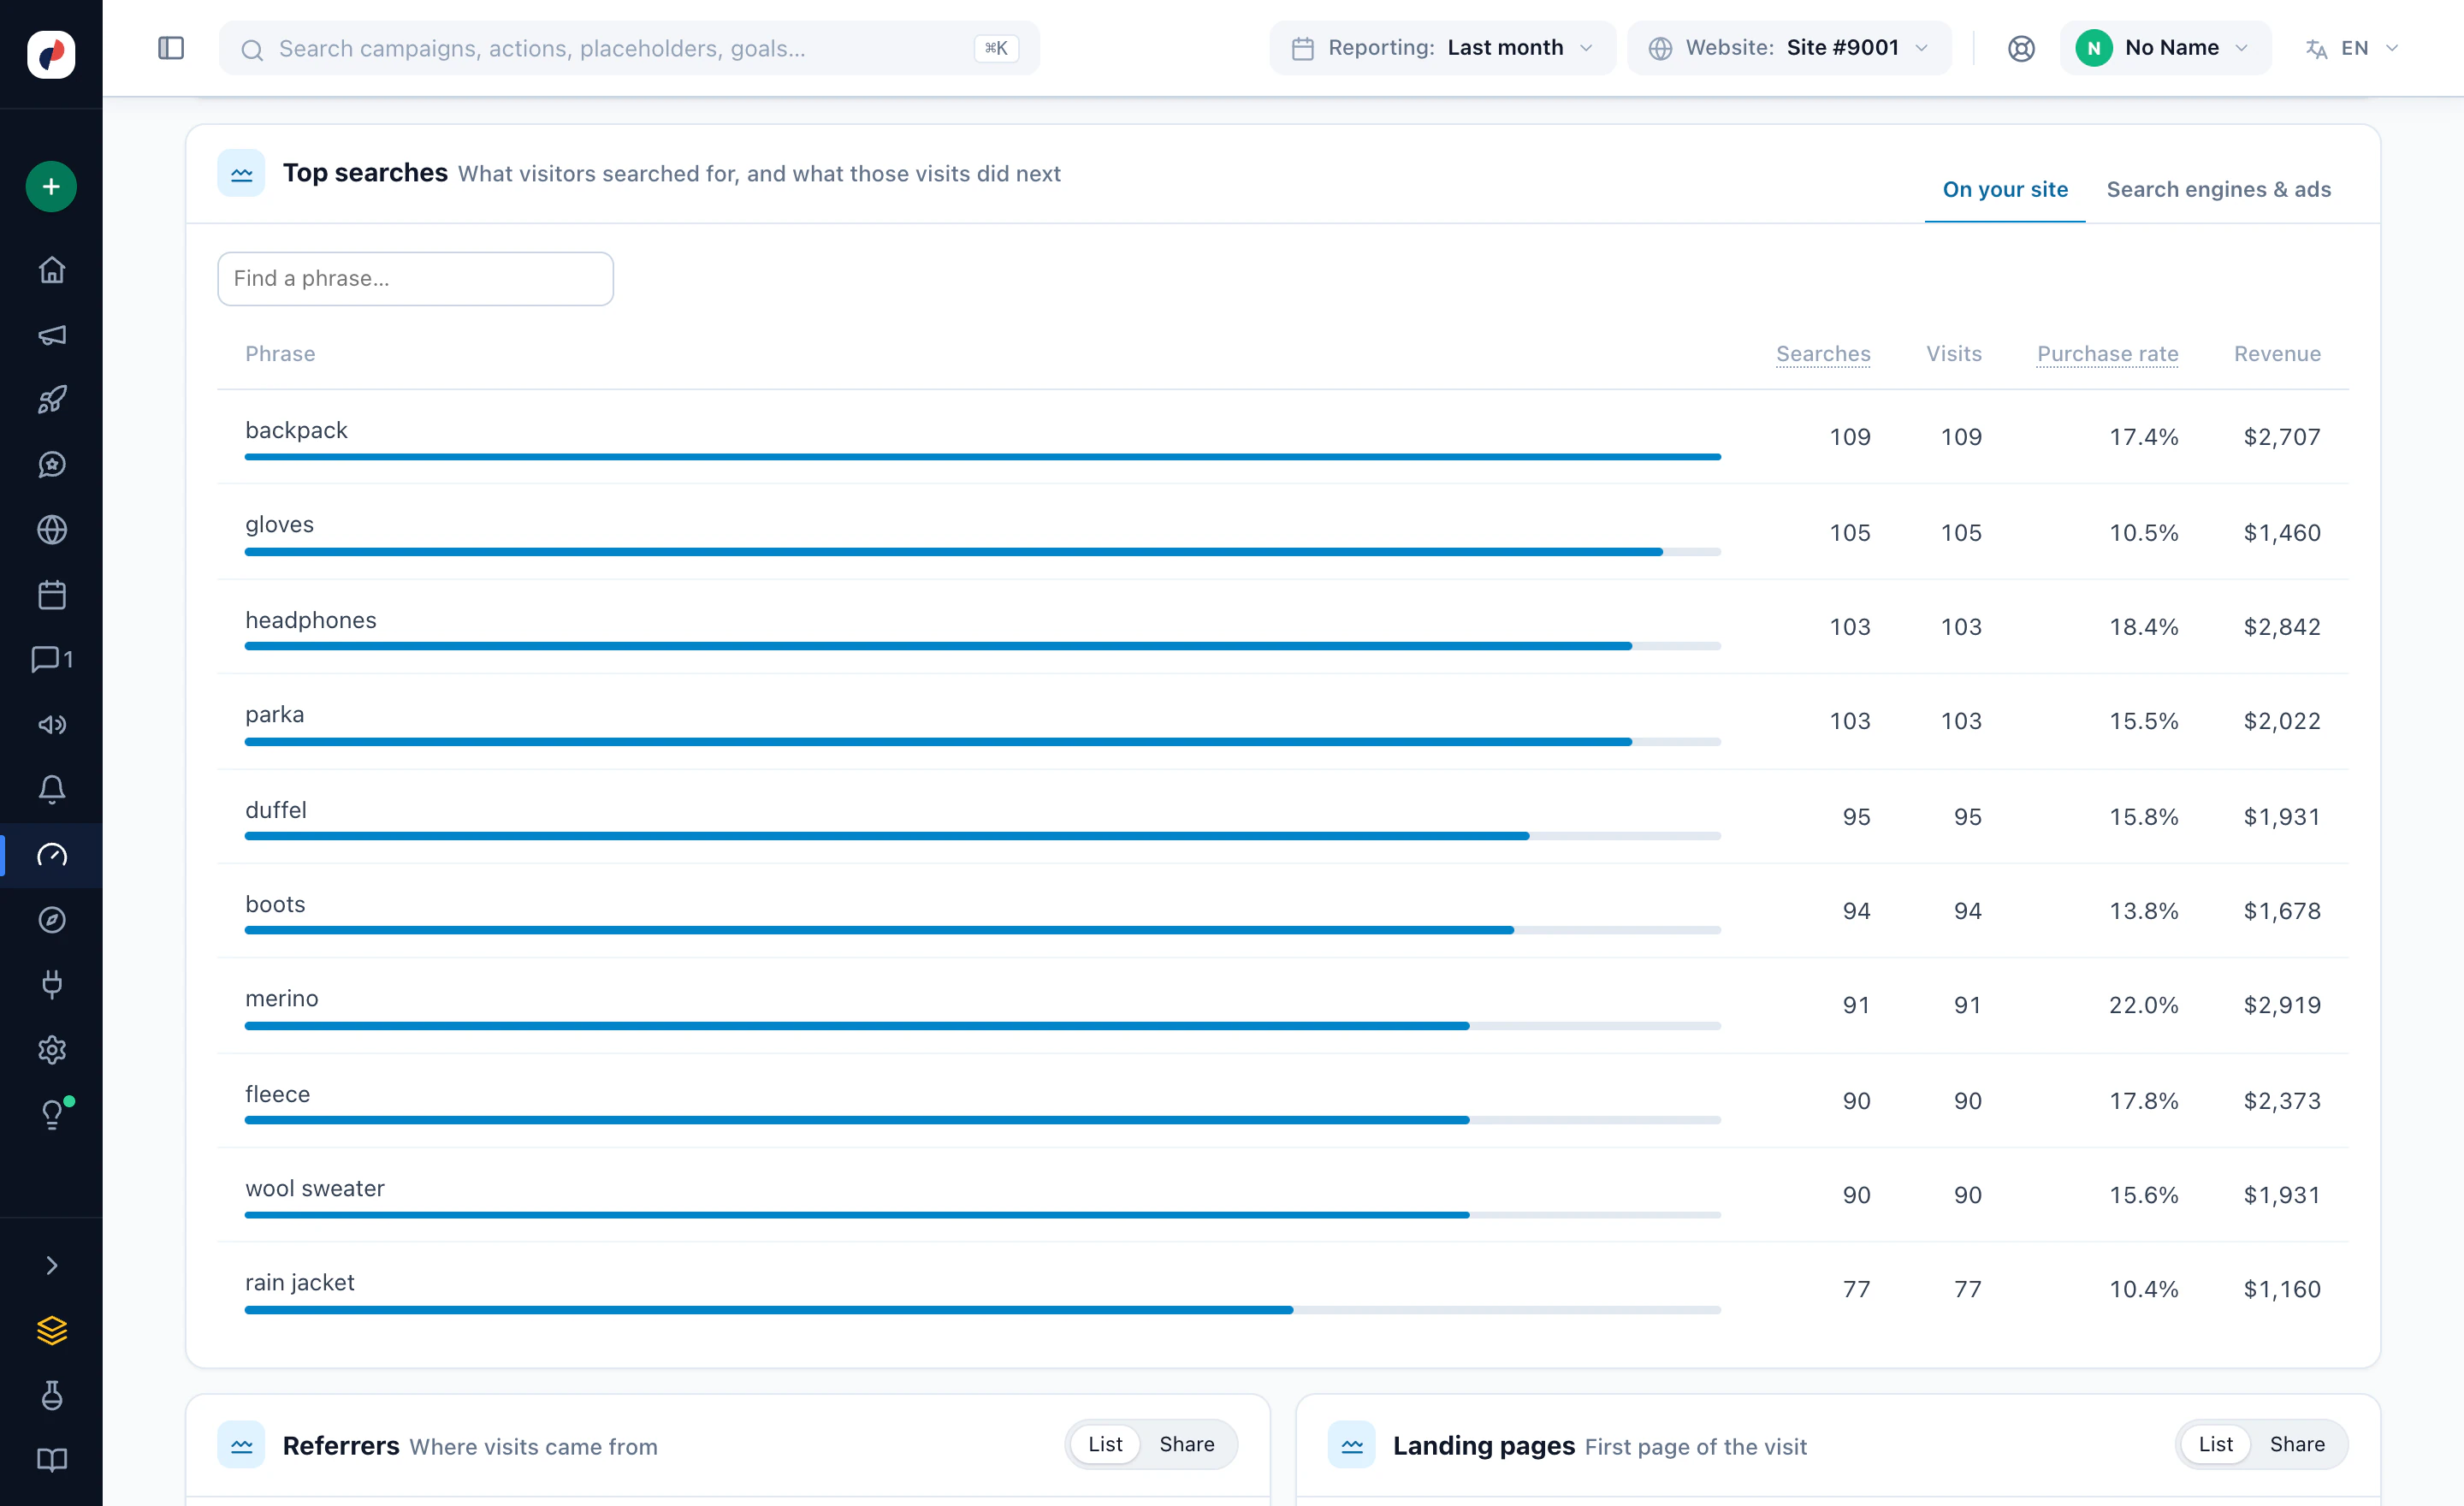
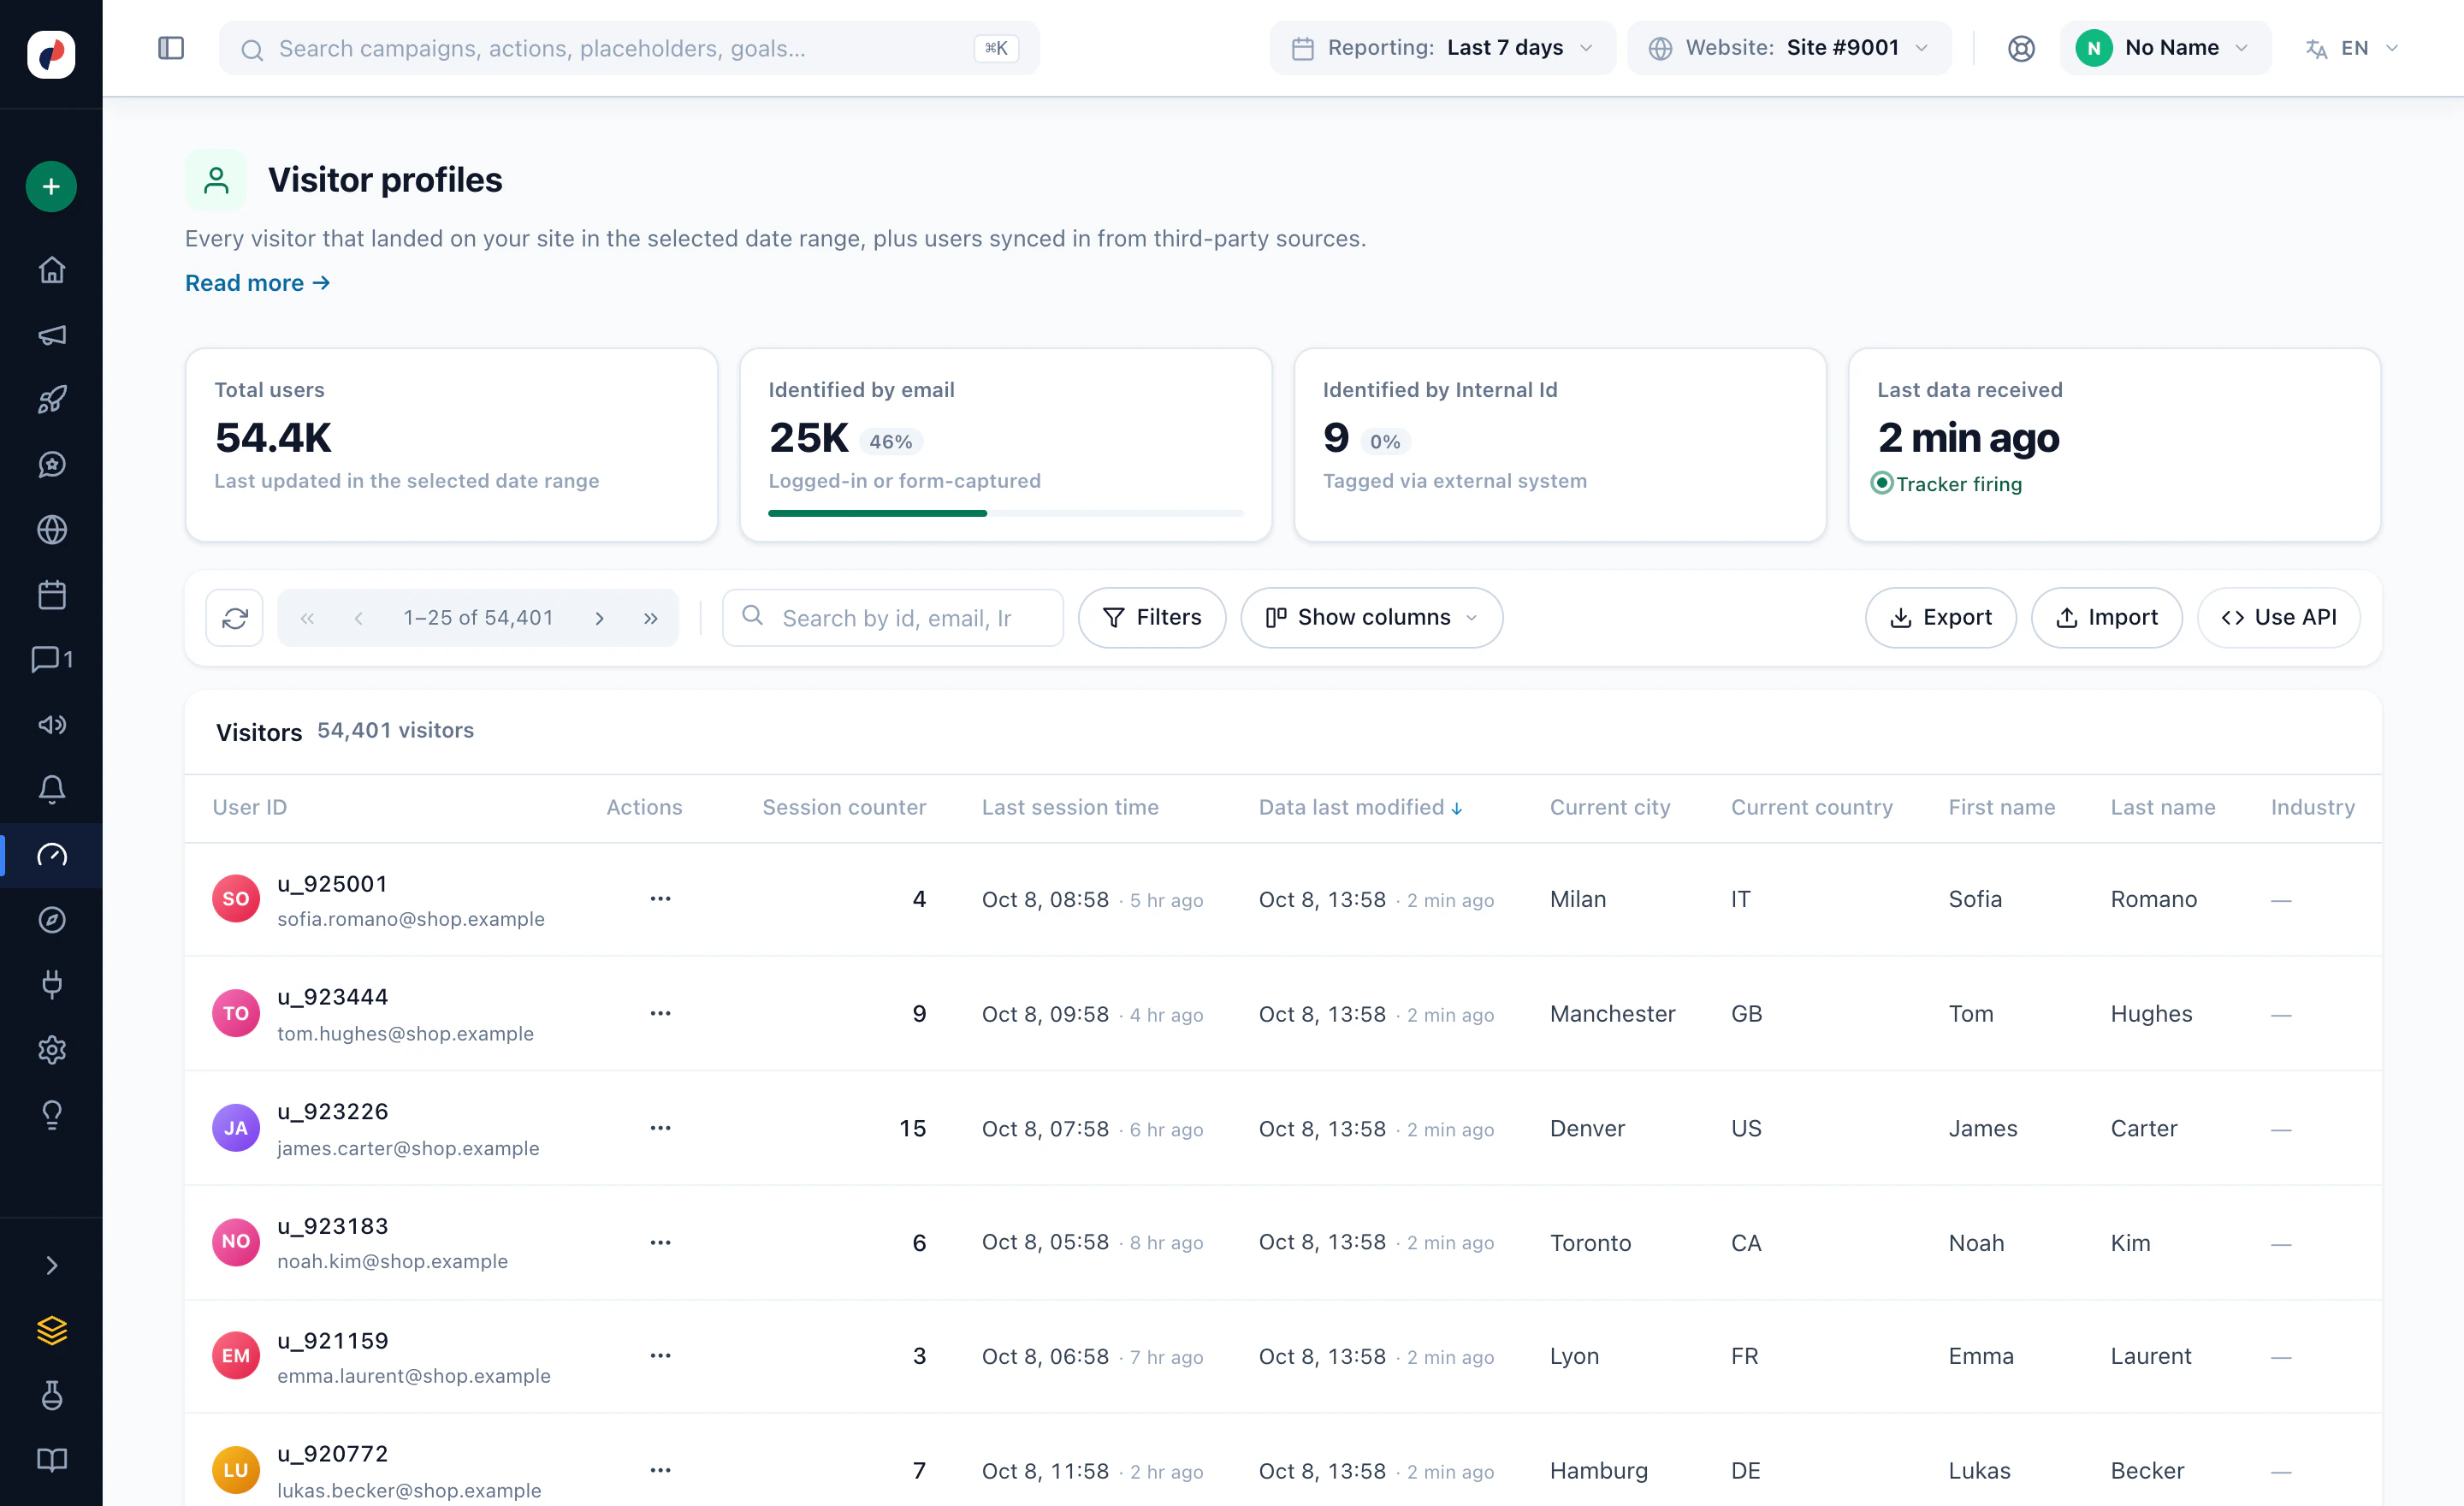
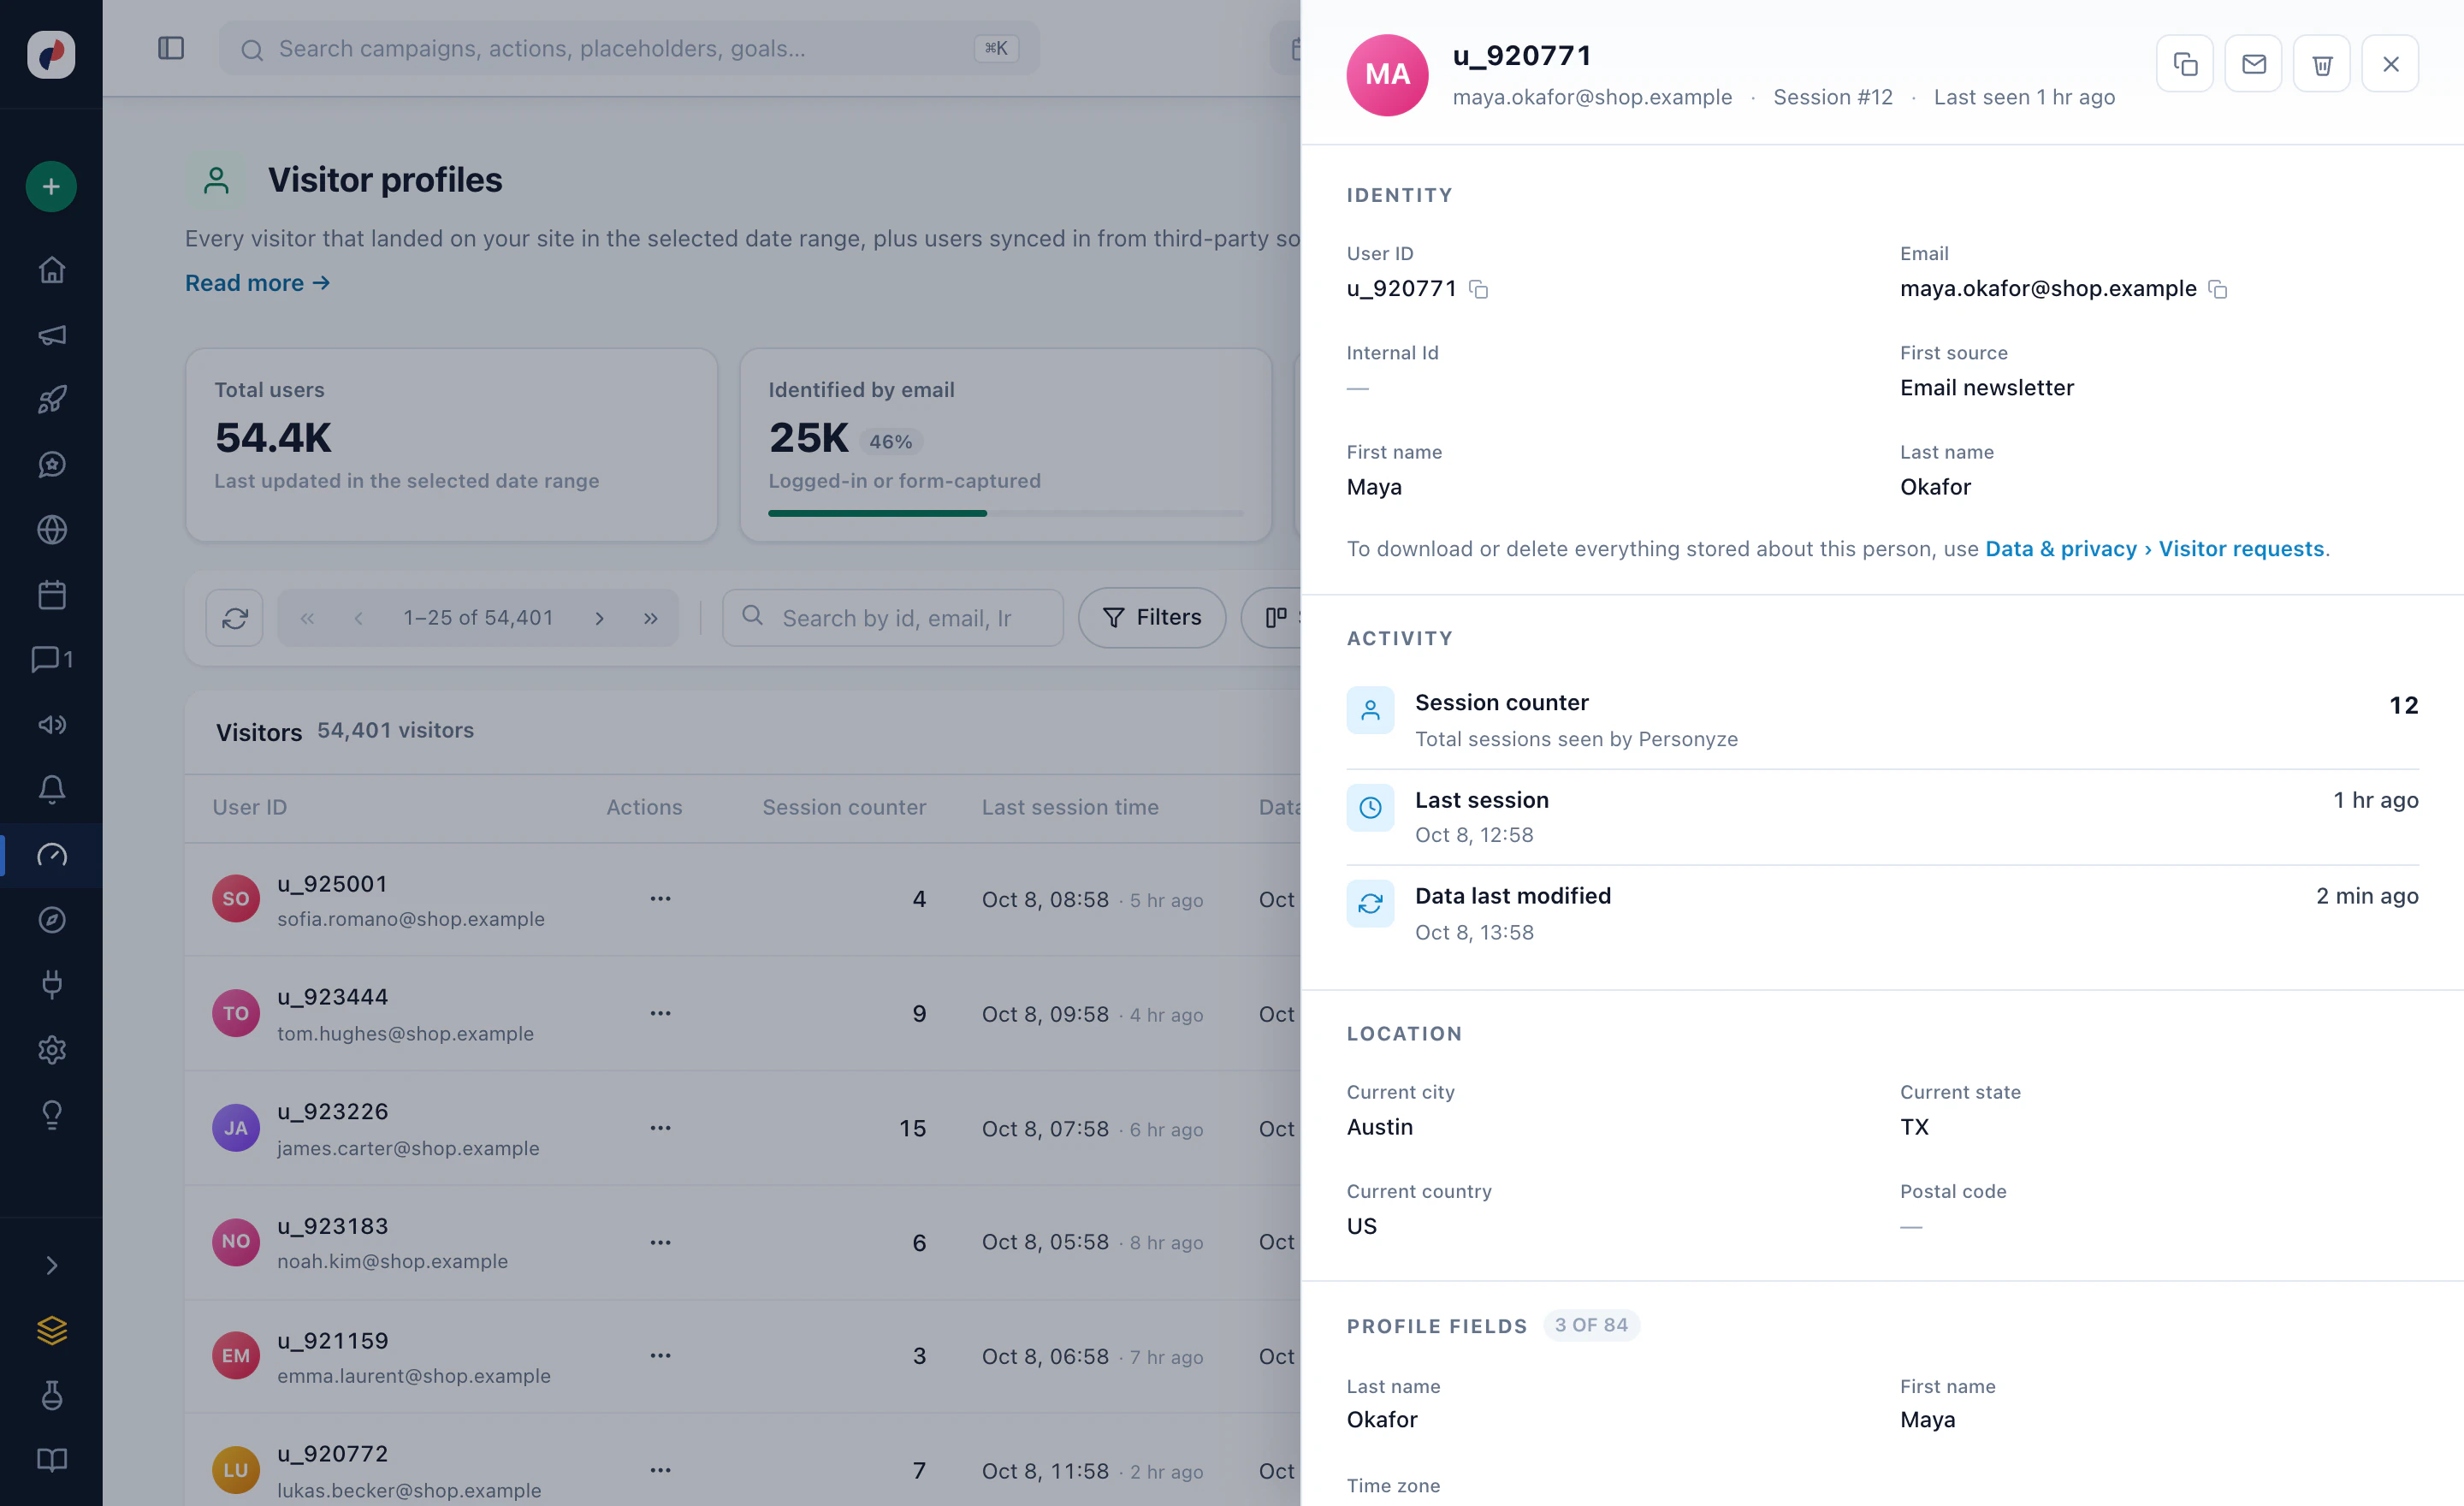
Sessions, bounce, revenue and conversion, the way you would expect. Then you click a row and there is a person — their name, their company, whatever your CRM and your enrichment know about them, and every campaign they were shown.
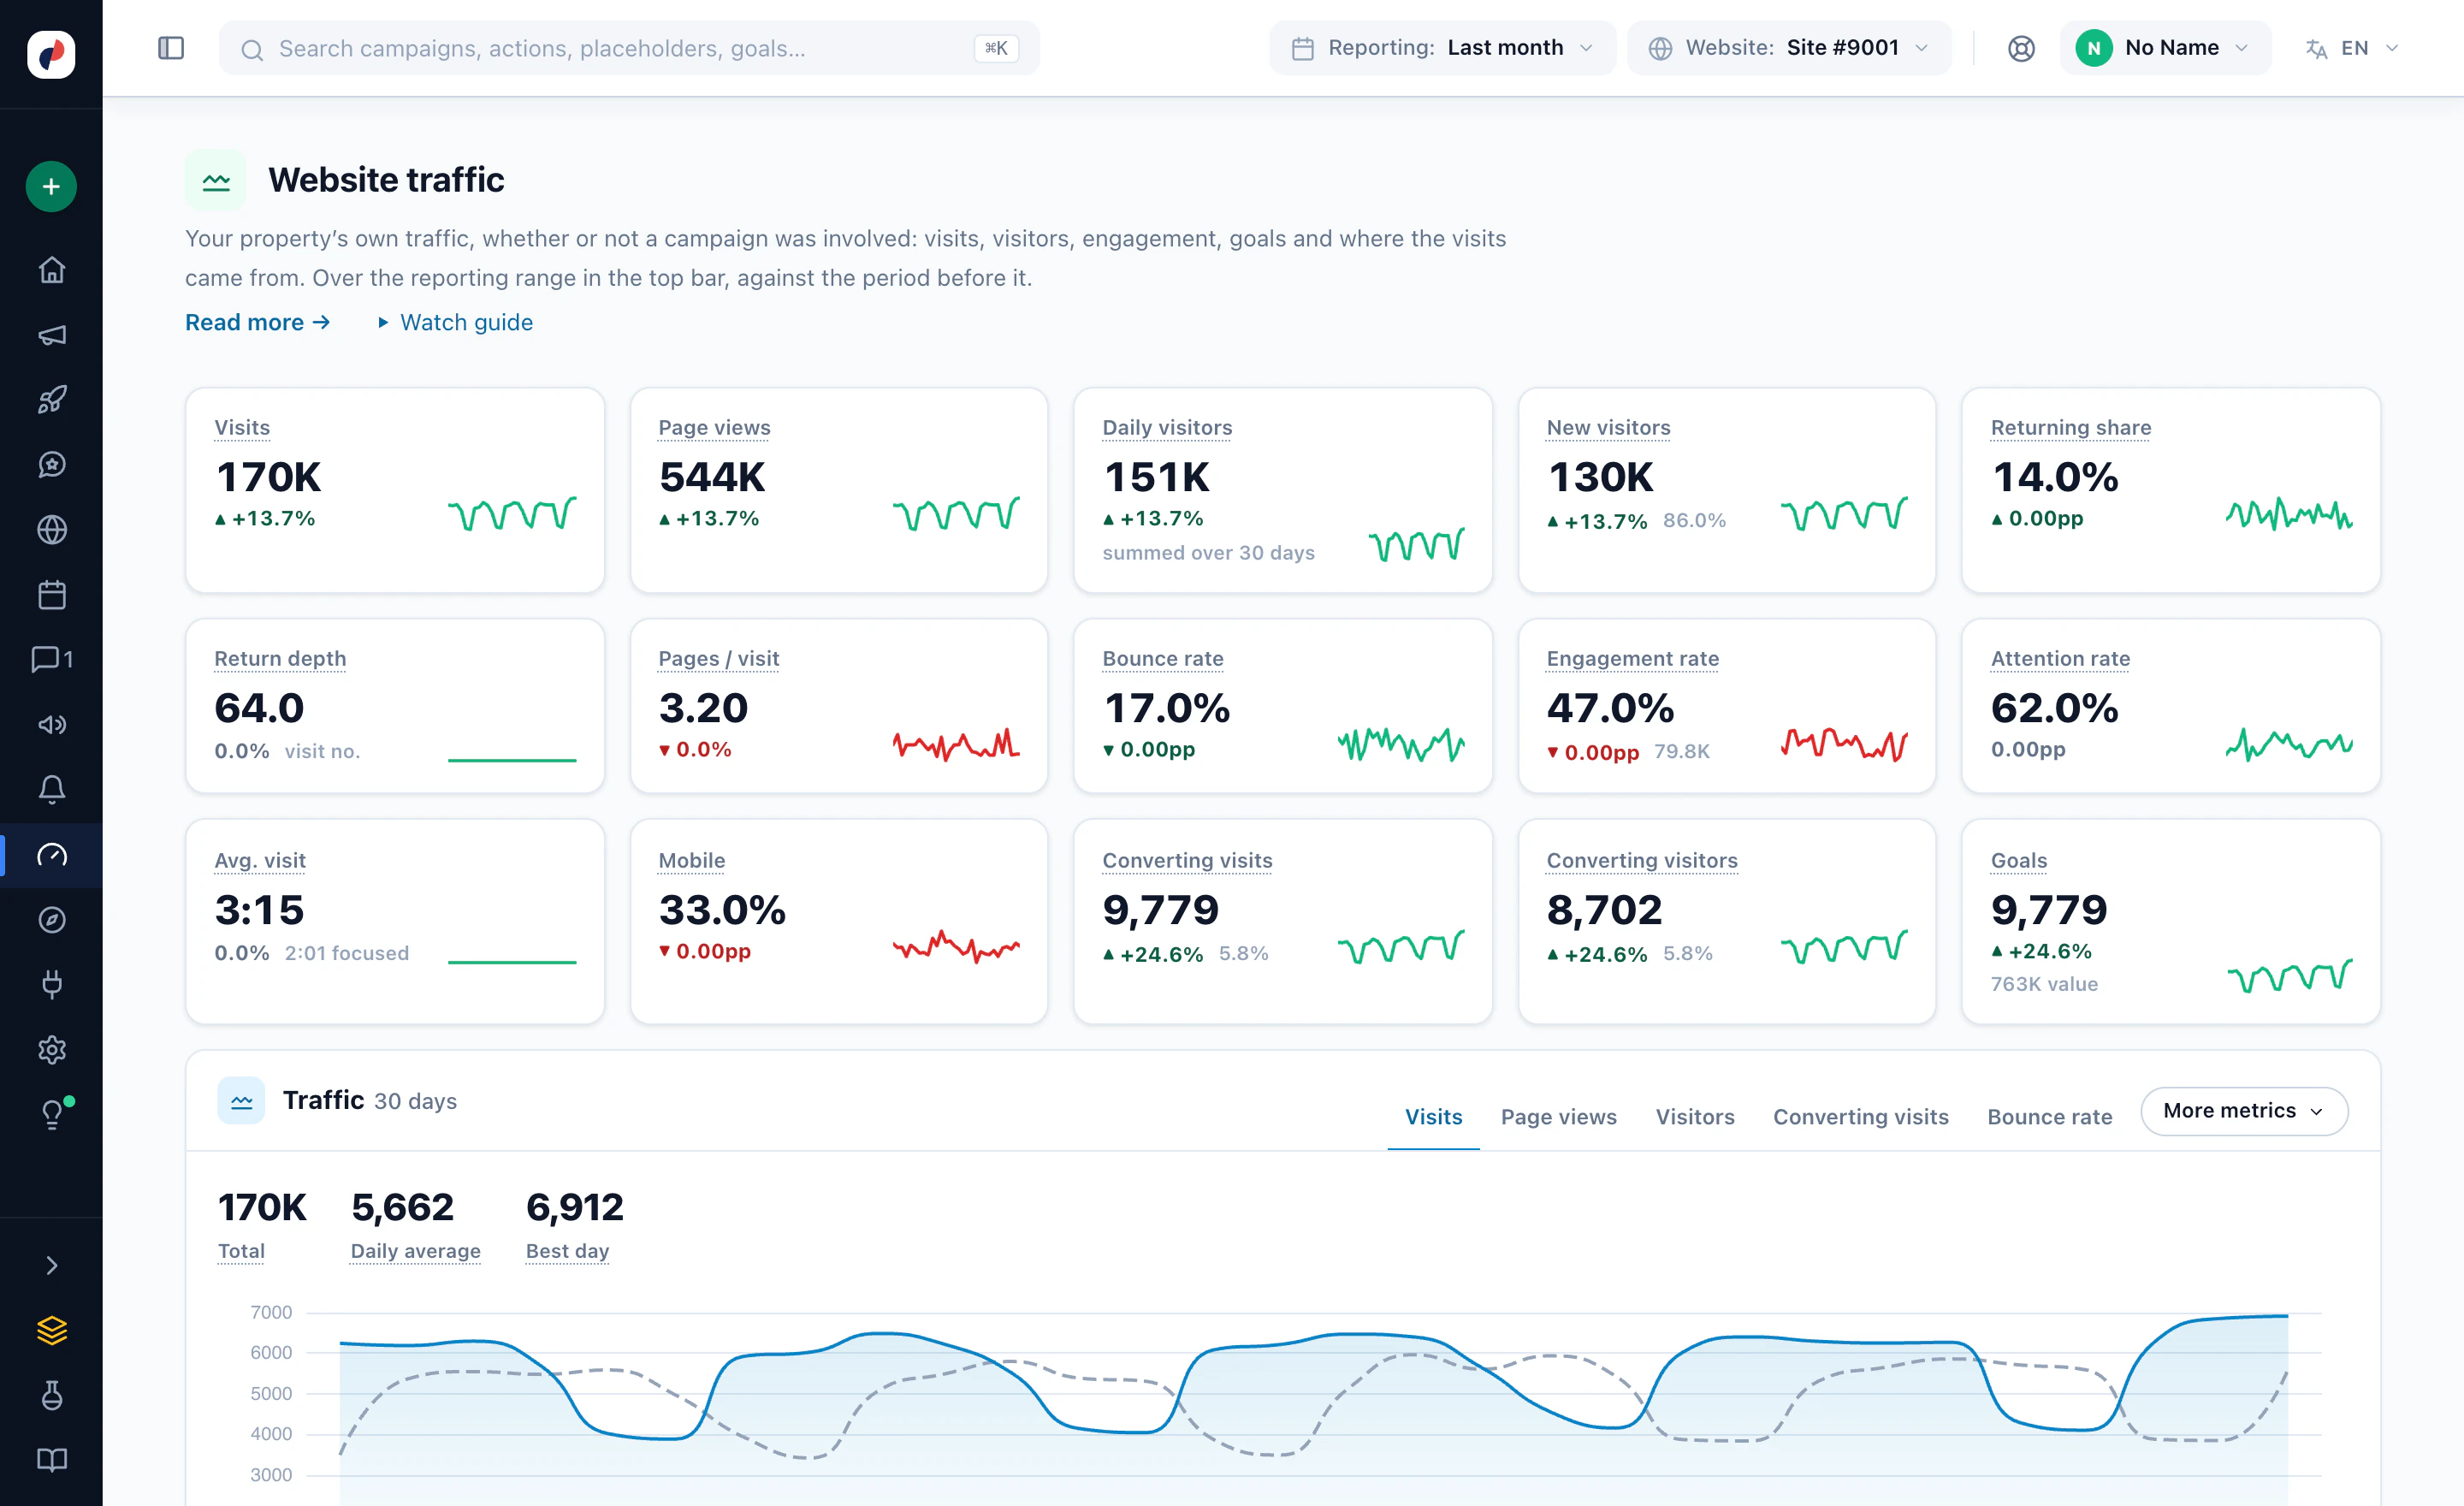
Not a report about your campaigns with a dashboard bolted on. The site numbers are first-class, computed from the same daily fold as everything else, so a campaign figure and a site figure can be put in the same sentence.
The site row is a first-class figure, computed by the same nightly fold as every campaign number — which is why a campaign figure and a site figure can be put in the same sentence without anybody having to explain the difference.
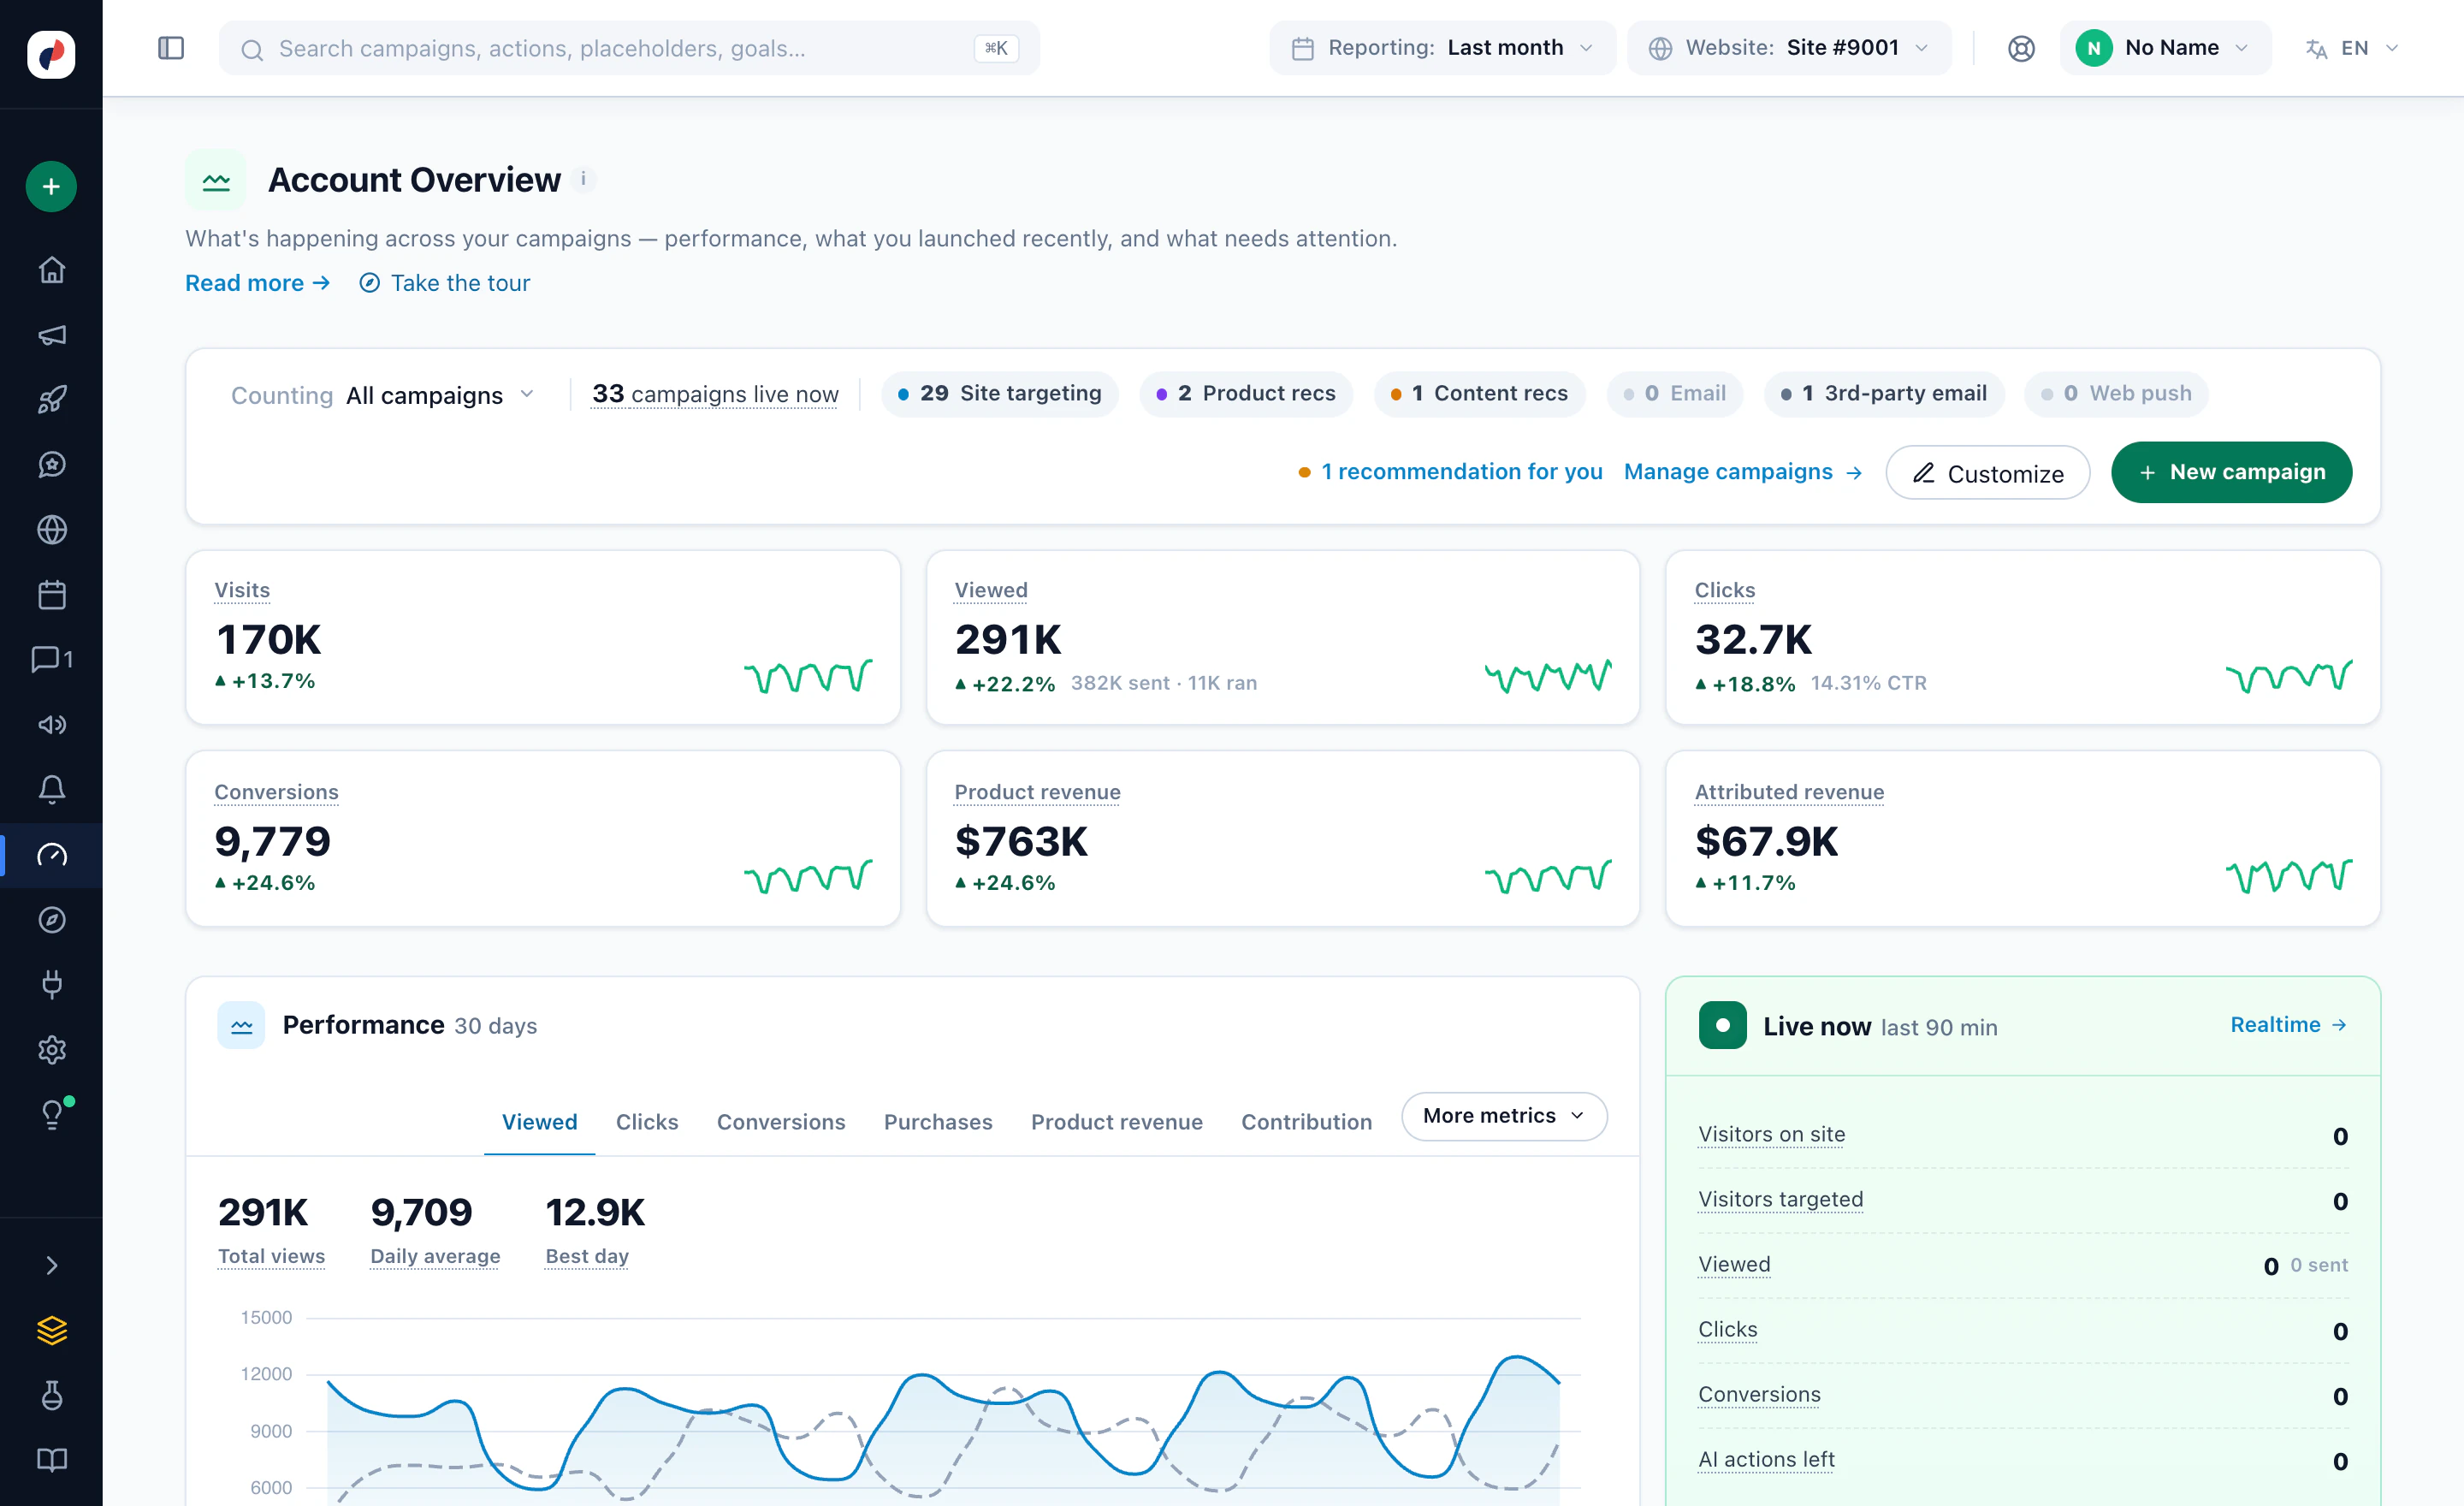
Two separate columns, kept separate everywhere. One counts what ran; the other counts what was confirmed on screen, with two thirds of the element in the viewport. Most platforms report the first and call it the second.
Twelve independent goal slots, each carrying its own completions, its own sessions and its own assigned value, reported separately rather than rolled into one “conversions” number that hides which one moved.
The interaction row carries the id of the action that produced it, so revenue from a recommendation is a recorded fact rather than a share-out. The funnel is stage to stage: each step is a percentage of the step before it, not of the first one.
An email open and a push impression are stored in the same column as an on-site delivery — and reported under the noun that is true for that channel. Which is why the email numbers and the on-site numbers can sit in one table.
The breakdown set is defined in one place and shared by the campaign dashboard, the editor’s performance step and the A/B results panel — so two screens cannot quietly disagree about what “Countries” means.
This is the part other analytics cannot do, because they never knew who anybody was. Every visitor is a row you can filter, sort, export and open.
Six people, six kinds of site, six questions they put to their own numbers. Pick a face and read what came back — answered from that report’s own columns, not from the internet.
Every report carries the questions people actually ask of it. When the data is not there, the answer says so rather than estimating.
Every card is a widget with its own scope and its own query. Which means the board you look at every morning can be the one you actually wanted, rather than the one that shipped.
GA4 is a good product and most sites should keep it. It counts sessions well, it is free, and it is where your acquisition reporting already lives. But it was designed around anonymous, aggregated events — so there is one question it structurally cannot answer, and it is usually the question you actually had.
The rate
The people
This is not a replacement pitch. Keep GA4 for acquisition and channel reporting — the two run side by side and the tag is independent, so nothing about your existing setup has to change. The reason to have this alongside it is that your personalization, your CRM data and your site numbers are computed in one place: a campaign figure and a site figure can go in the same sentence, and the row underneath has a name on it.
Reporting is where platforms quietly make themselves look good. These three go the other way, and they are the reason the rest of the numbers are worth quoting.
One counts what ran. The other counts what was confirmed on screen — two thirds of the element in the viewport. In email the same two columns are Sent and Opened; on push, Sent and Shown. They are never added together and never used interchangeably.
Click-through needs a hundred impressions, an open rate needs fifty sends, a site-wide bounce rate needs two hundred sessions. Below the floor the report says not enough data instead of printing 18.2% from eleven visits.
Today’s totals are still being written. A rule that compared against them would fire according to scheduling luck, so the window ends yesterday. Exact, and one day behind, on purpose.
GA4 reports on anonymous, aggregated events, so it can tell you that 4.2% of sessions converted but not which people did. Personyze computes the same site figures — sessions, bounce, attention, revenue, conversion — and every row can be opened to a person, with their name, company, CRM fields and every campaign they were shown. Most teams keep GA4 for acquisition reporting and use this for the visitor-level question.
No. They run side by side and answer different questions. The tag is independent, so nothing about your existing GA4 setup has to change.
From your own tag and your own integrations. Behaviour is collected first-party as people use your site, and identity fields arrive when somebody identifies themselves or when a CRM or enrichment connector syncs them onto the profile.
You can look a person up by email or internal id and delete them outright — that is the erasure path, and it is a button rather than a support ticket. You can also export what you hold about them. The data is first-party by construction: collected by your own tag, held in your own account.
Because a rate needs enough behind it to mean anything. Click-through needs a hundred impressions, an open rate needs fifty sends, and a site-wide bounce rate needs two hundred sessions. Below that floor the report says so rather than printing 18.2% from eleven visits.
They are counted separately and never added together. One counts what ran; the other counts what was confirmed on screen — two thirds of the element in the viewport. In email the equivalent pair is Sent and Opened, and on push it is Sent and Shown.
Three years of reporting history, with the date window set once in the top bar so every screen reads the same period. Fourteen presets are included, and previous 7 days is a preset of its own so a like-for-like comparison needs no arithmetic.
Yes. The overview is made of widgets — add and remove cards, start from a preset, set the scope once and every widget follows it, keep more than one board, share it with the team, have it arrive by email on a schedule, or put it on a wallboard.
Put the tag on, and the first dashboard fills in on its own. The names arrive as soon as anybody identifies themselves.