

What Personalization Actually Gets Clicked: Benchmarks From 32 Live Accounts
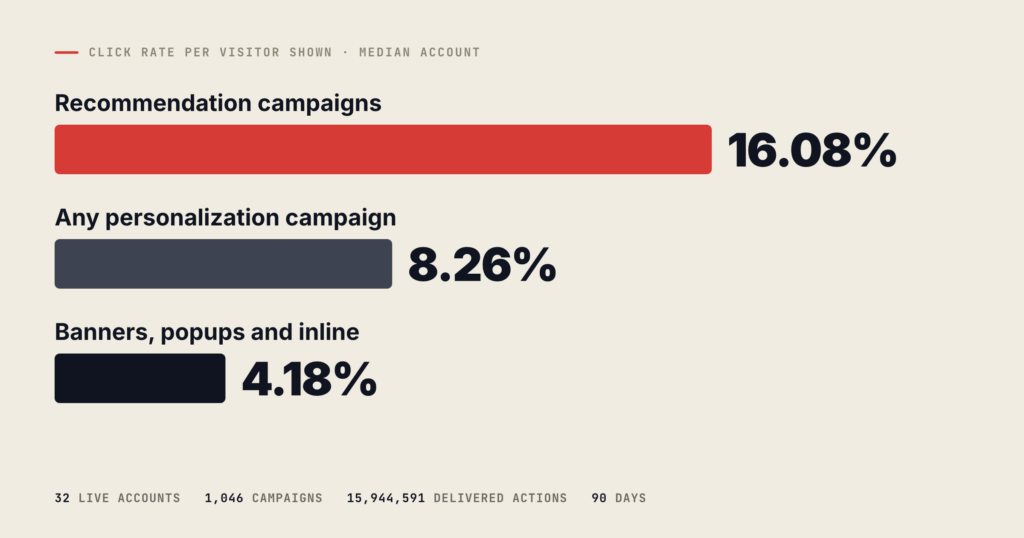
Ask what a good click rate is for on-site personalization and you will get numbers with no denominator attached — which is the same as getting no number at all. We measured ours across 32 live accounts, 1,046 campaigns and 15,944,591 delivered actions over 90 days, and published both denominators rather than the flattering one.
The numbers
Two honest ways to count a click. Per visitor shown asks how many of the people who were actually shown a campaign clicked it — the same shape as an email click rate, which is per recipient. Per impression divides by deliveries, the same shape as a display advertising CTR. The median session here is shown 1.45 actions, so the second reads about a third lower than the first for identical performance.
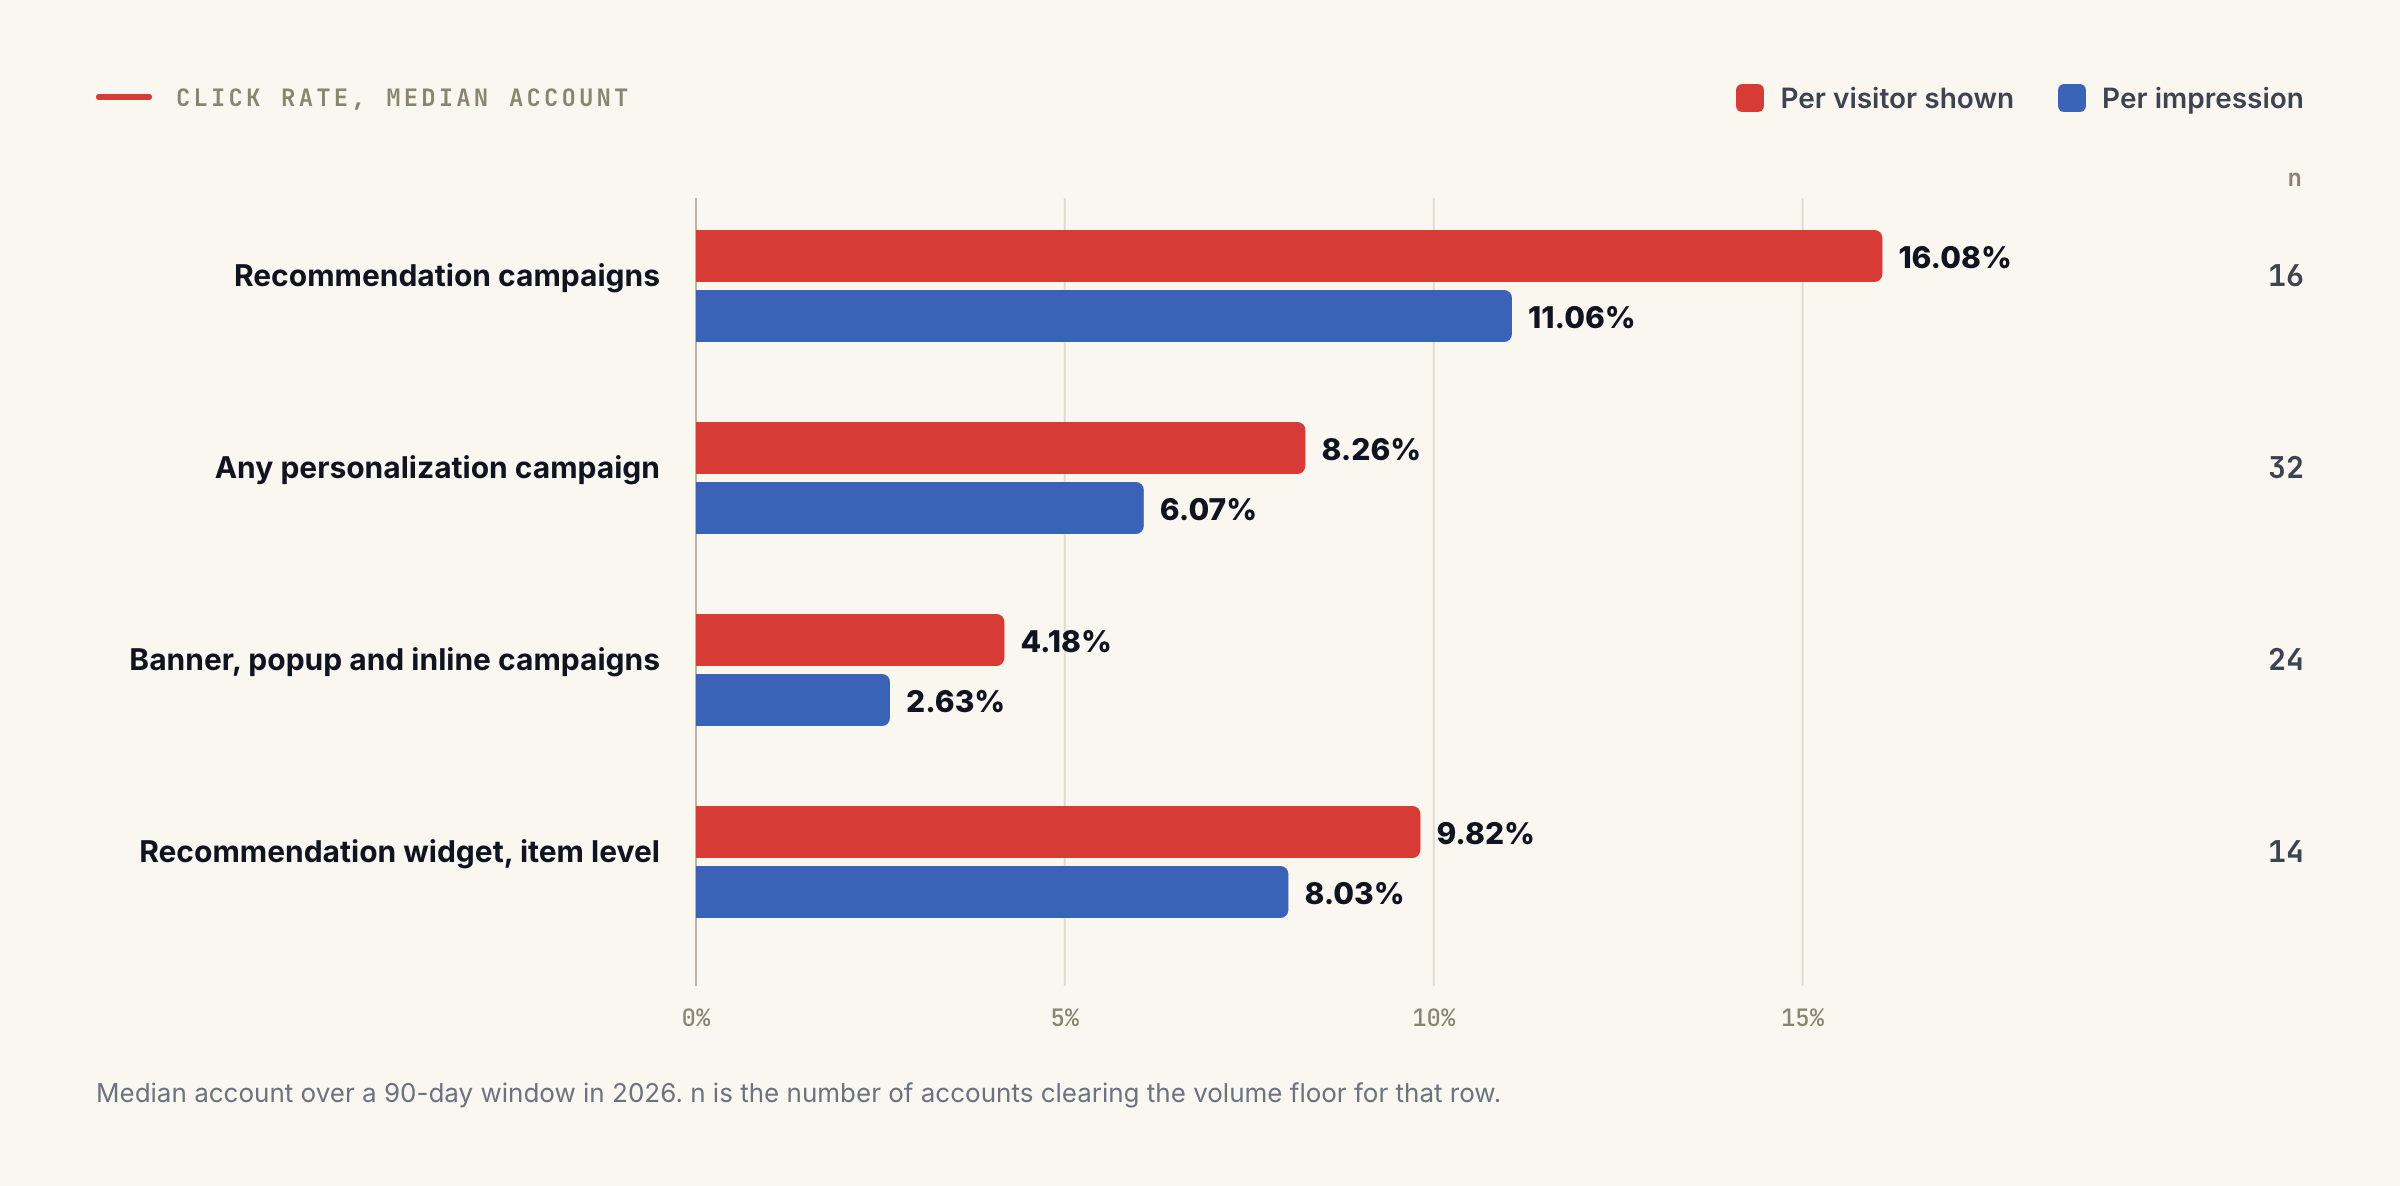
| Click rate, median account | Per visitor shown | Per impression | n |
|---|---|---|---|
| Recommendation campaigns | 16.08% | 11.06% | 16 |
| Any personalization campaign | 8.26% | 6.07% | 32 |
| Banner, popup and inline campaigns | 4.18% | 2.63% | 24 |
| Recommendation widget, item level | 9.82% | 8.03% | 14 |
Median account, over a 90-day window in 2026. n is the number of accounts clearing the volume floor for that row. Every figure has a range behind it, published in the report.
What the campaign is matters more than what industry you are in
The widest gap in the data is not between verticals. It is between content and interruption: a recommendation widget is clicked by 16.08% of the visitors who see it, a banner or popup by 4.18%. Roughly four to one, on the same sites, in the same window. A visitor clicks a recommendation because it is part of what they came to look at; a banner asks them to stop doing that first.
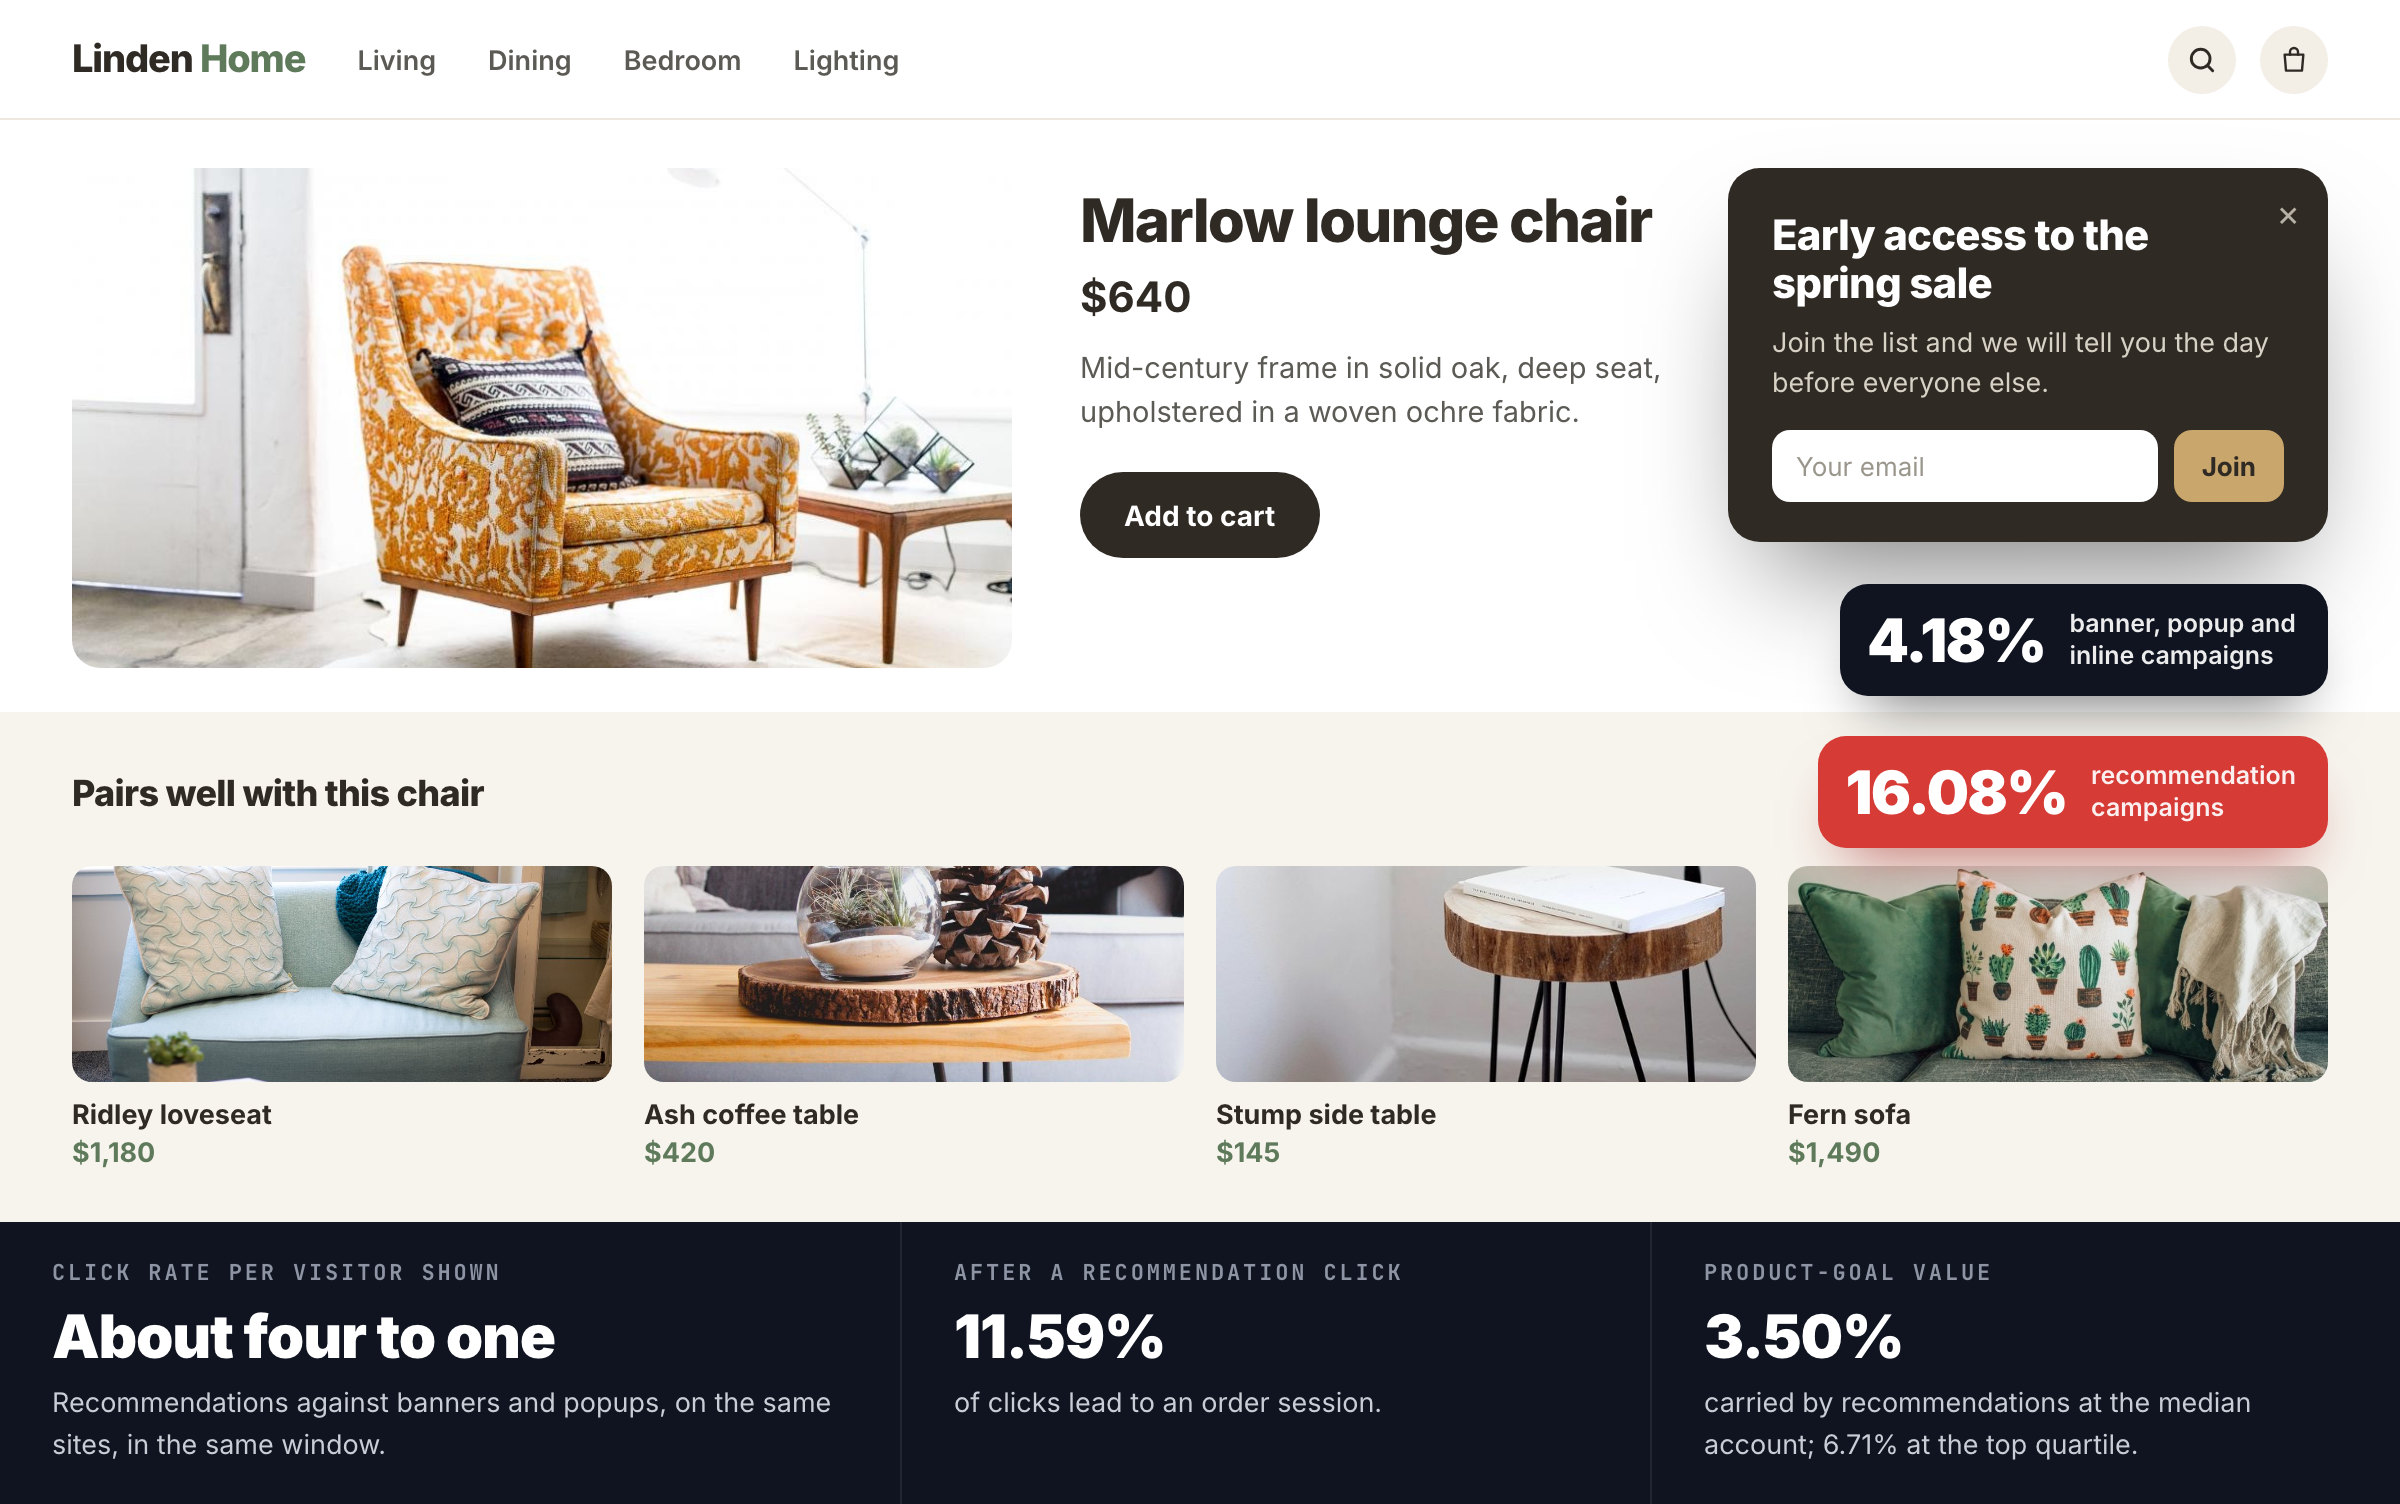
After the click, 11.59% of recommendation clicks lead to an order session, and recommendations carry 3.50% of product-goal value at the median account — 6.71% at the top quartile. That last figure is the one that survives scrutiny: click rates are easy to move, attributed value is not.
Why the sample is 32 and not 2,649
Because signing up is not running personalization. An account counts only if it is switched on, has at least one active production campaign and one live action, and delivered at least 500 actions inside the window. That takes a roster of 2,649 accounts down to 117 running personalization at all, and 32 with enough volume to benchmark. Campaigns published only to staging never reach the figures, and traffic an account tags as testing — its own team, on its own office IP — is discarded before archiving.
The report also lists what the data cannot say: no industry breakdown, because site type is recorded for only 5 of the 32; no campaign conversion rate, because the per-campaign goal counter is populated for exactly one account; no new-versus-returning split, because the two are counted on different bases. A benchmark is judged on what it refuses to claim.
How to use it
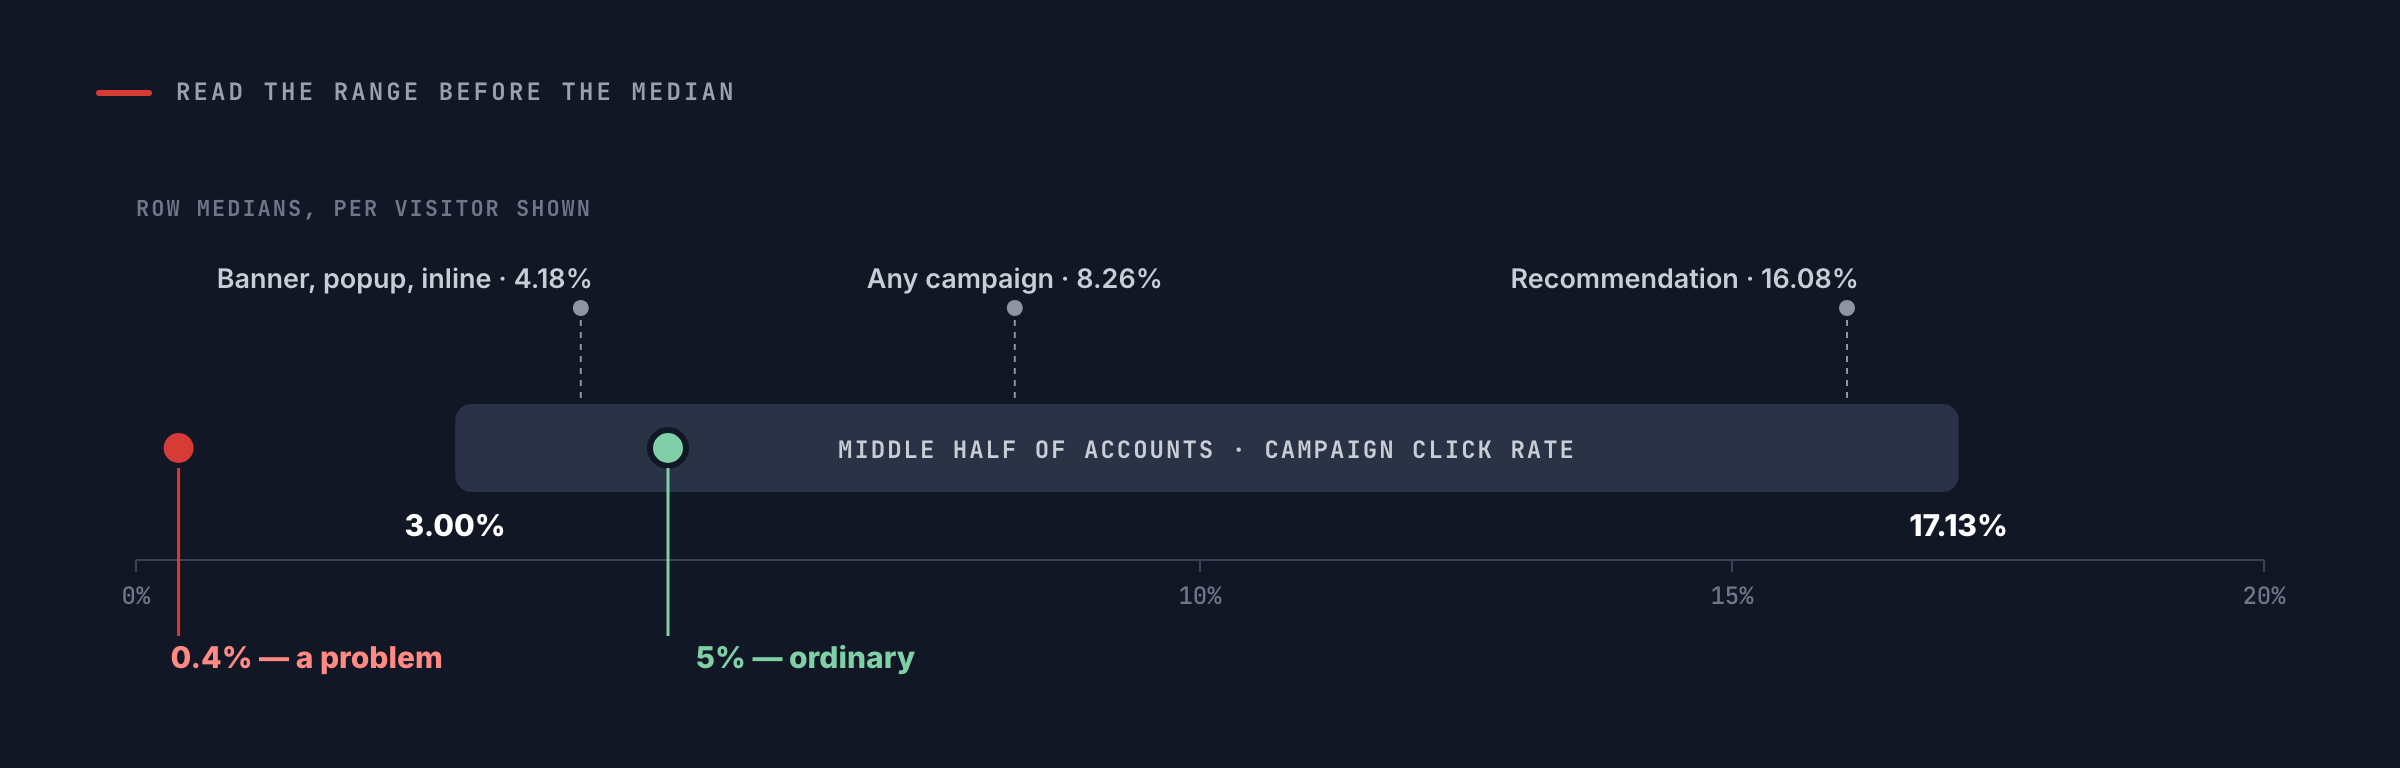
Compare like with like. A recommendation widget belongs against the 16.08% row, not against the blended 8.26%; a newsletter popup belongs against 4.18%. Read the range before the median — the middle half of accounts on campaign click rate runs from 3.00% to 17.13%, so sitting at 5% is ordinary and sitting at 0.4% is a problem. And check which denominator a competing number uses before you hold yourself to it.
Related reading: how the recommendation engine picks items, A/B testing that reads results by audience, and building the audience in the first place.
Book a demo with a personalization expert
30 minutes with a personalization expert. Bring your stack, your goals, your skepticism. We'll show you what changes when every visit feels like the only one.